How Automations is Predicted to Reduce Workplace Injury
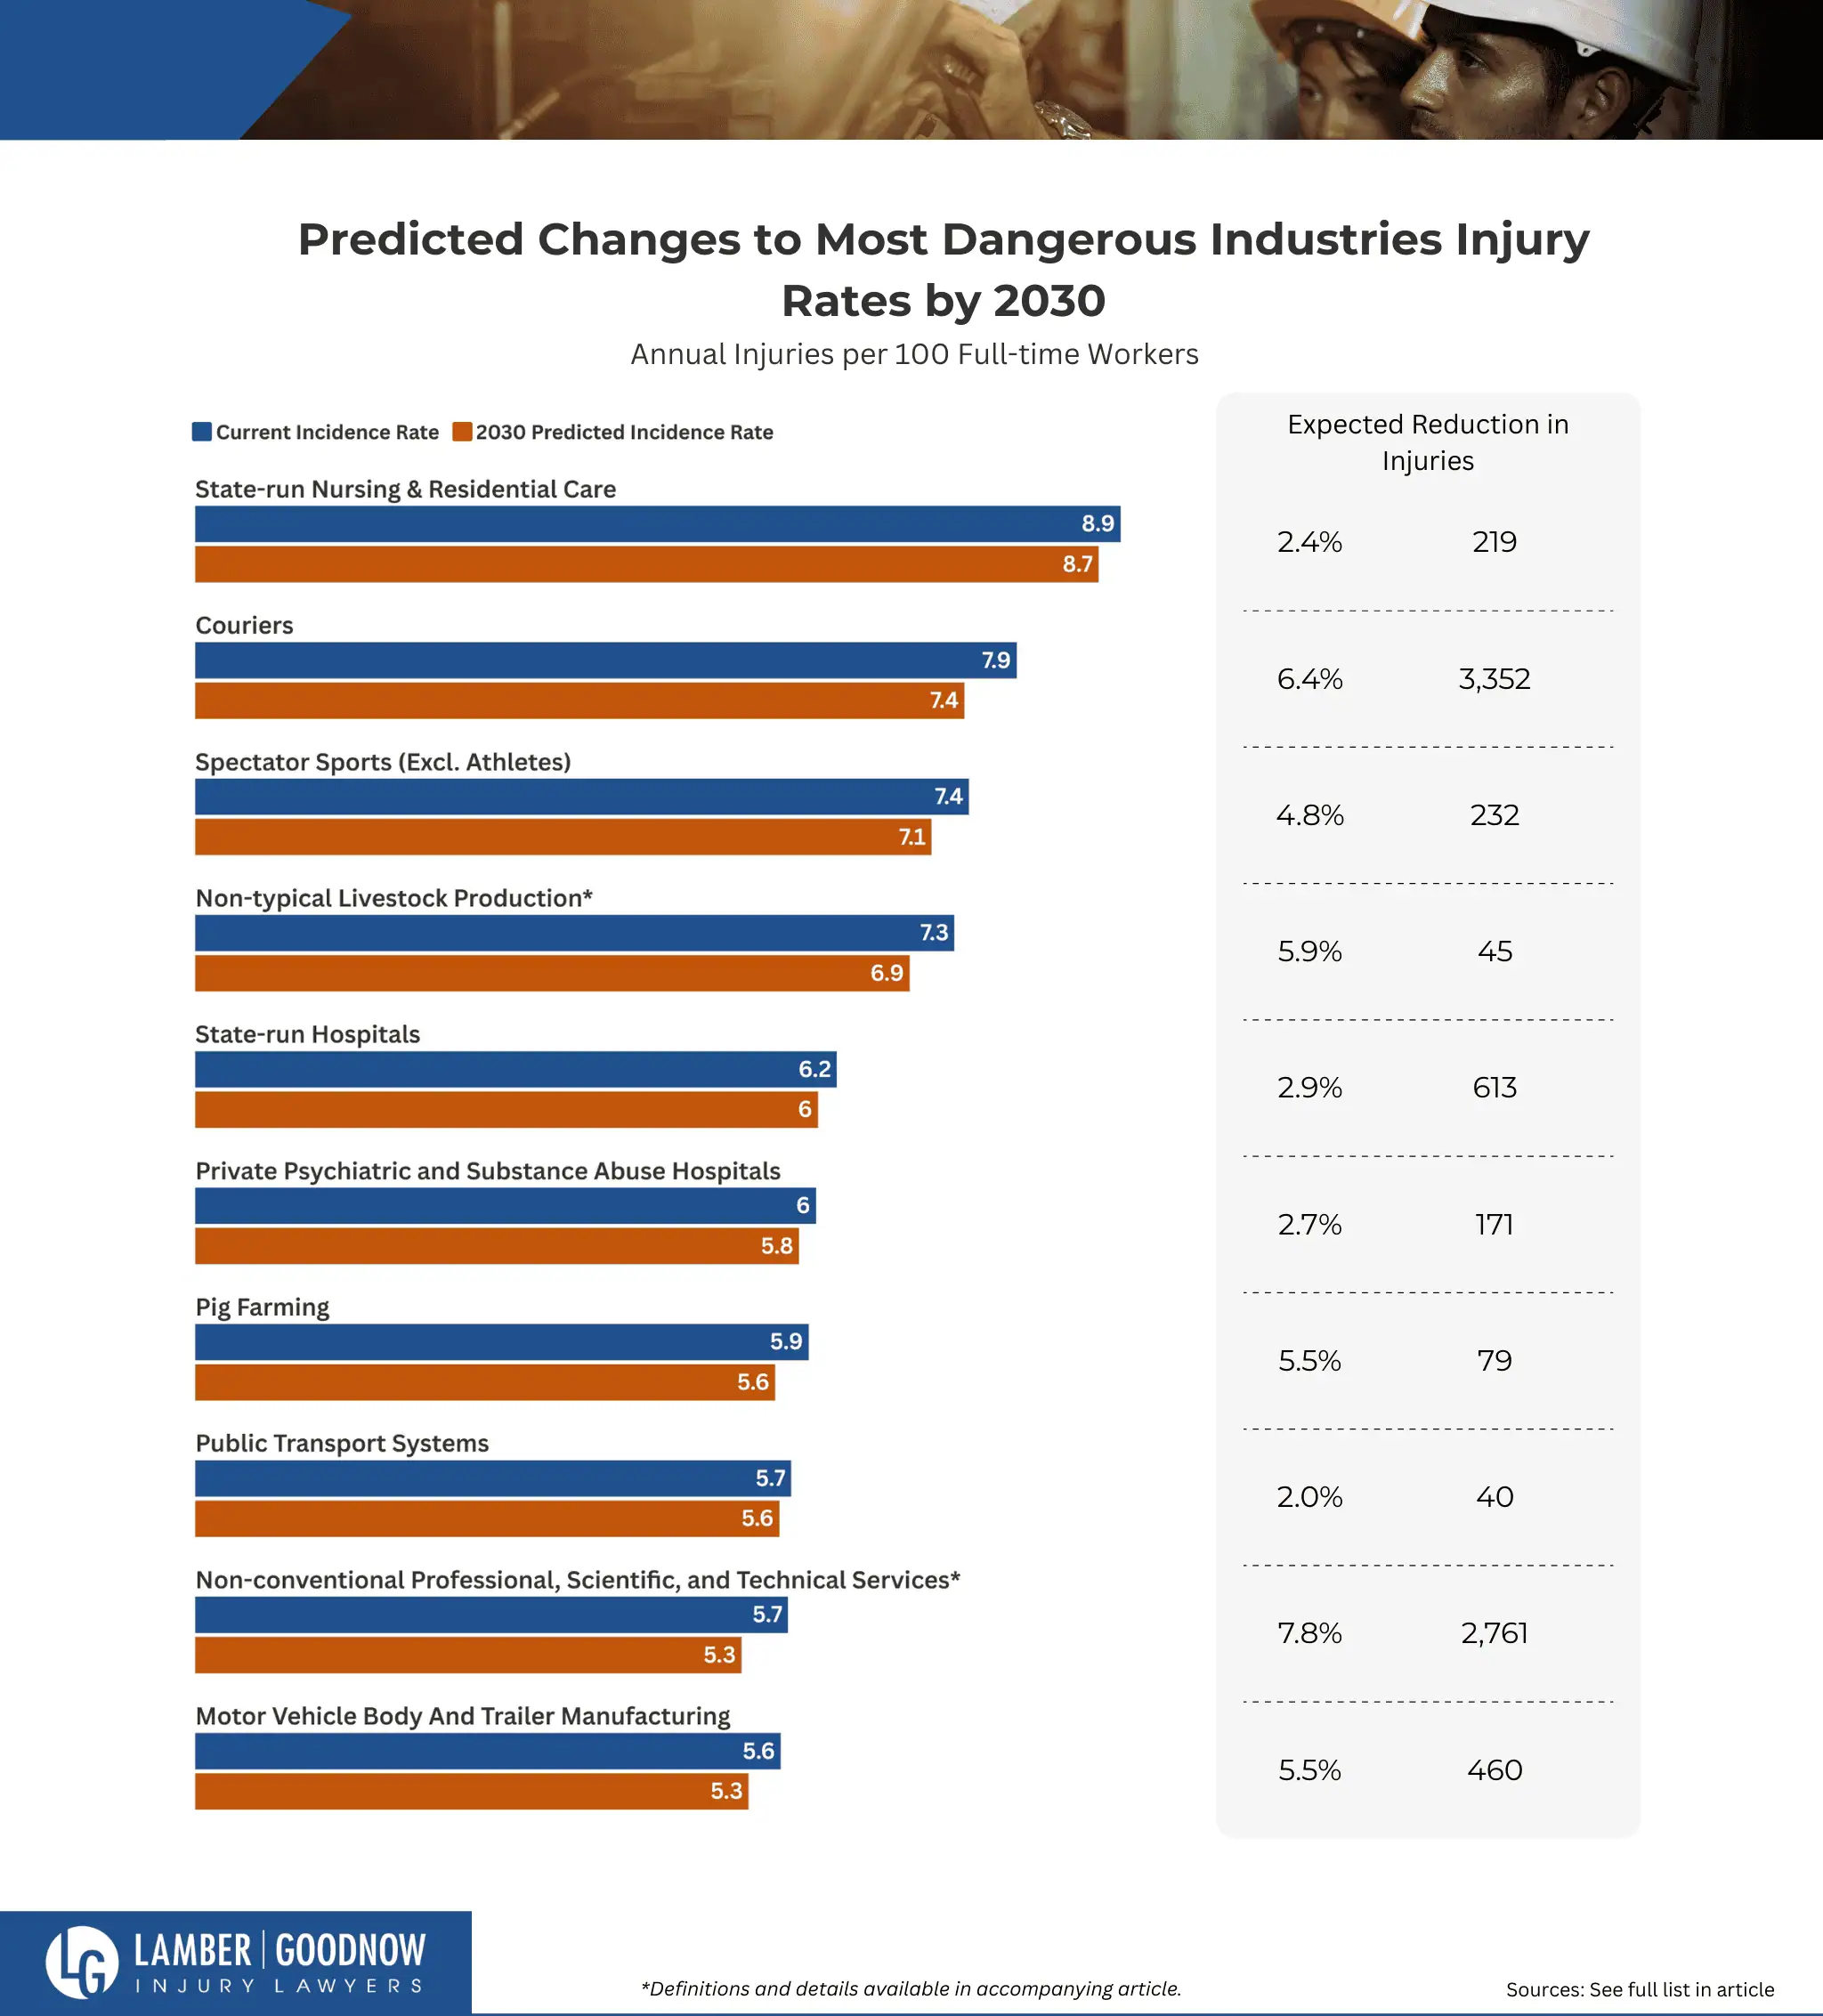
Spectator Sports is the most dangerous industry to work in, but State-run Health Care is the most dangerous sector overall.
30% of current work tasks are predicted to be automated by 2030, with every sector being automated at least 22%.
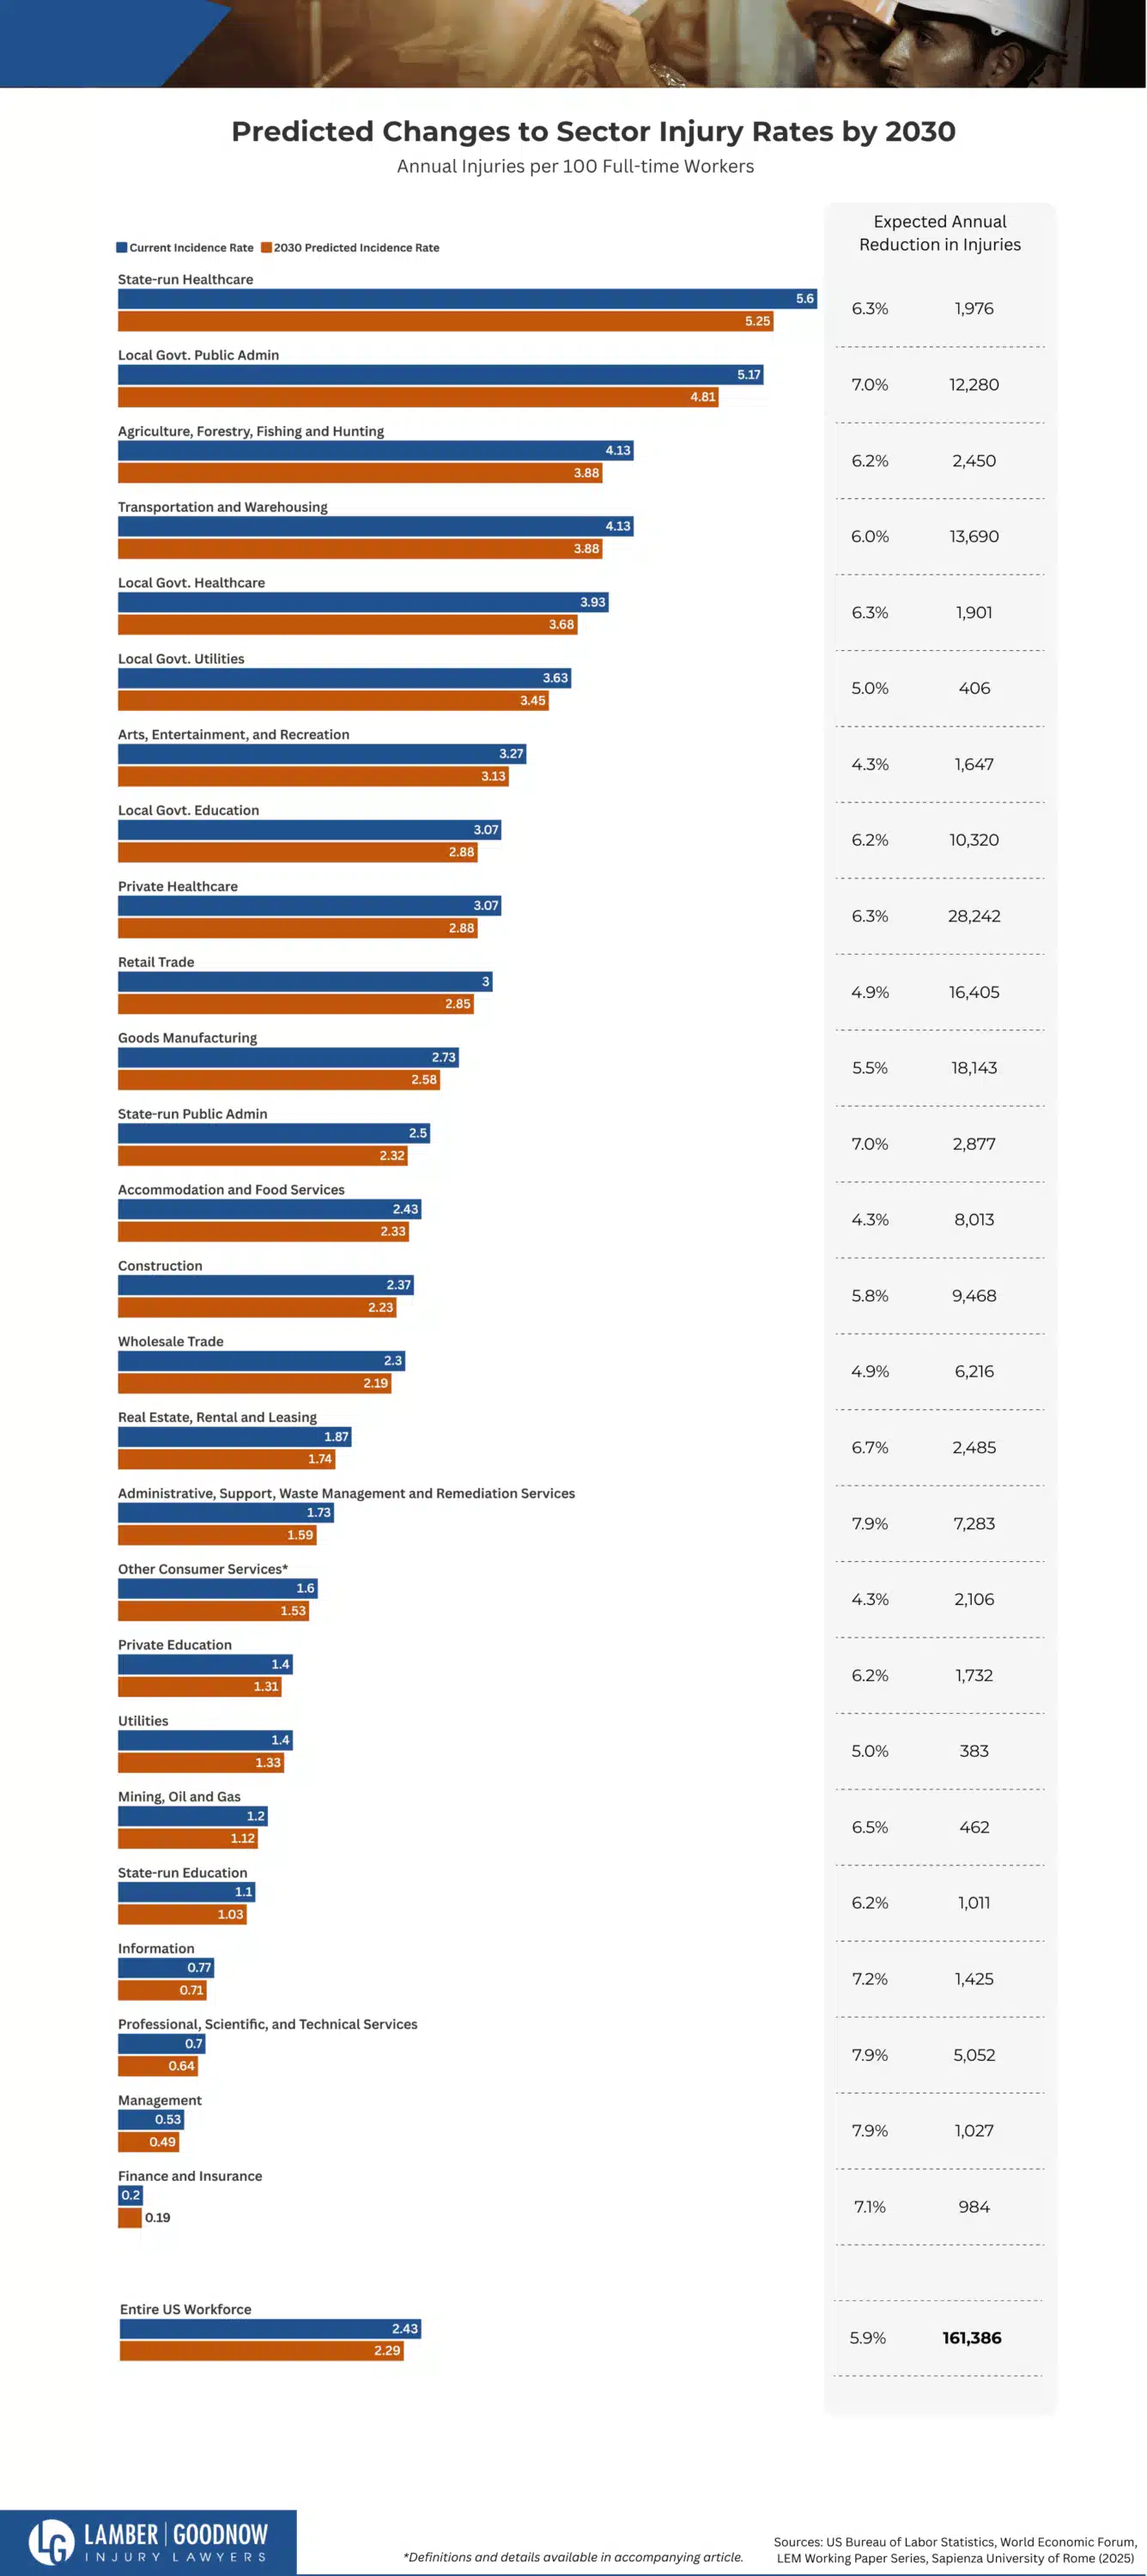
This level of automation is expected to lead to approximately 6% fewer occupational injuries annually by 2030.
However, when looking at an industry-level breakdown, some of the most dangerous are likely to only become 2% safer.
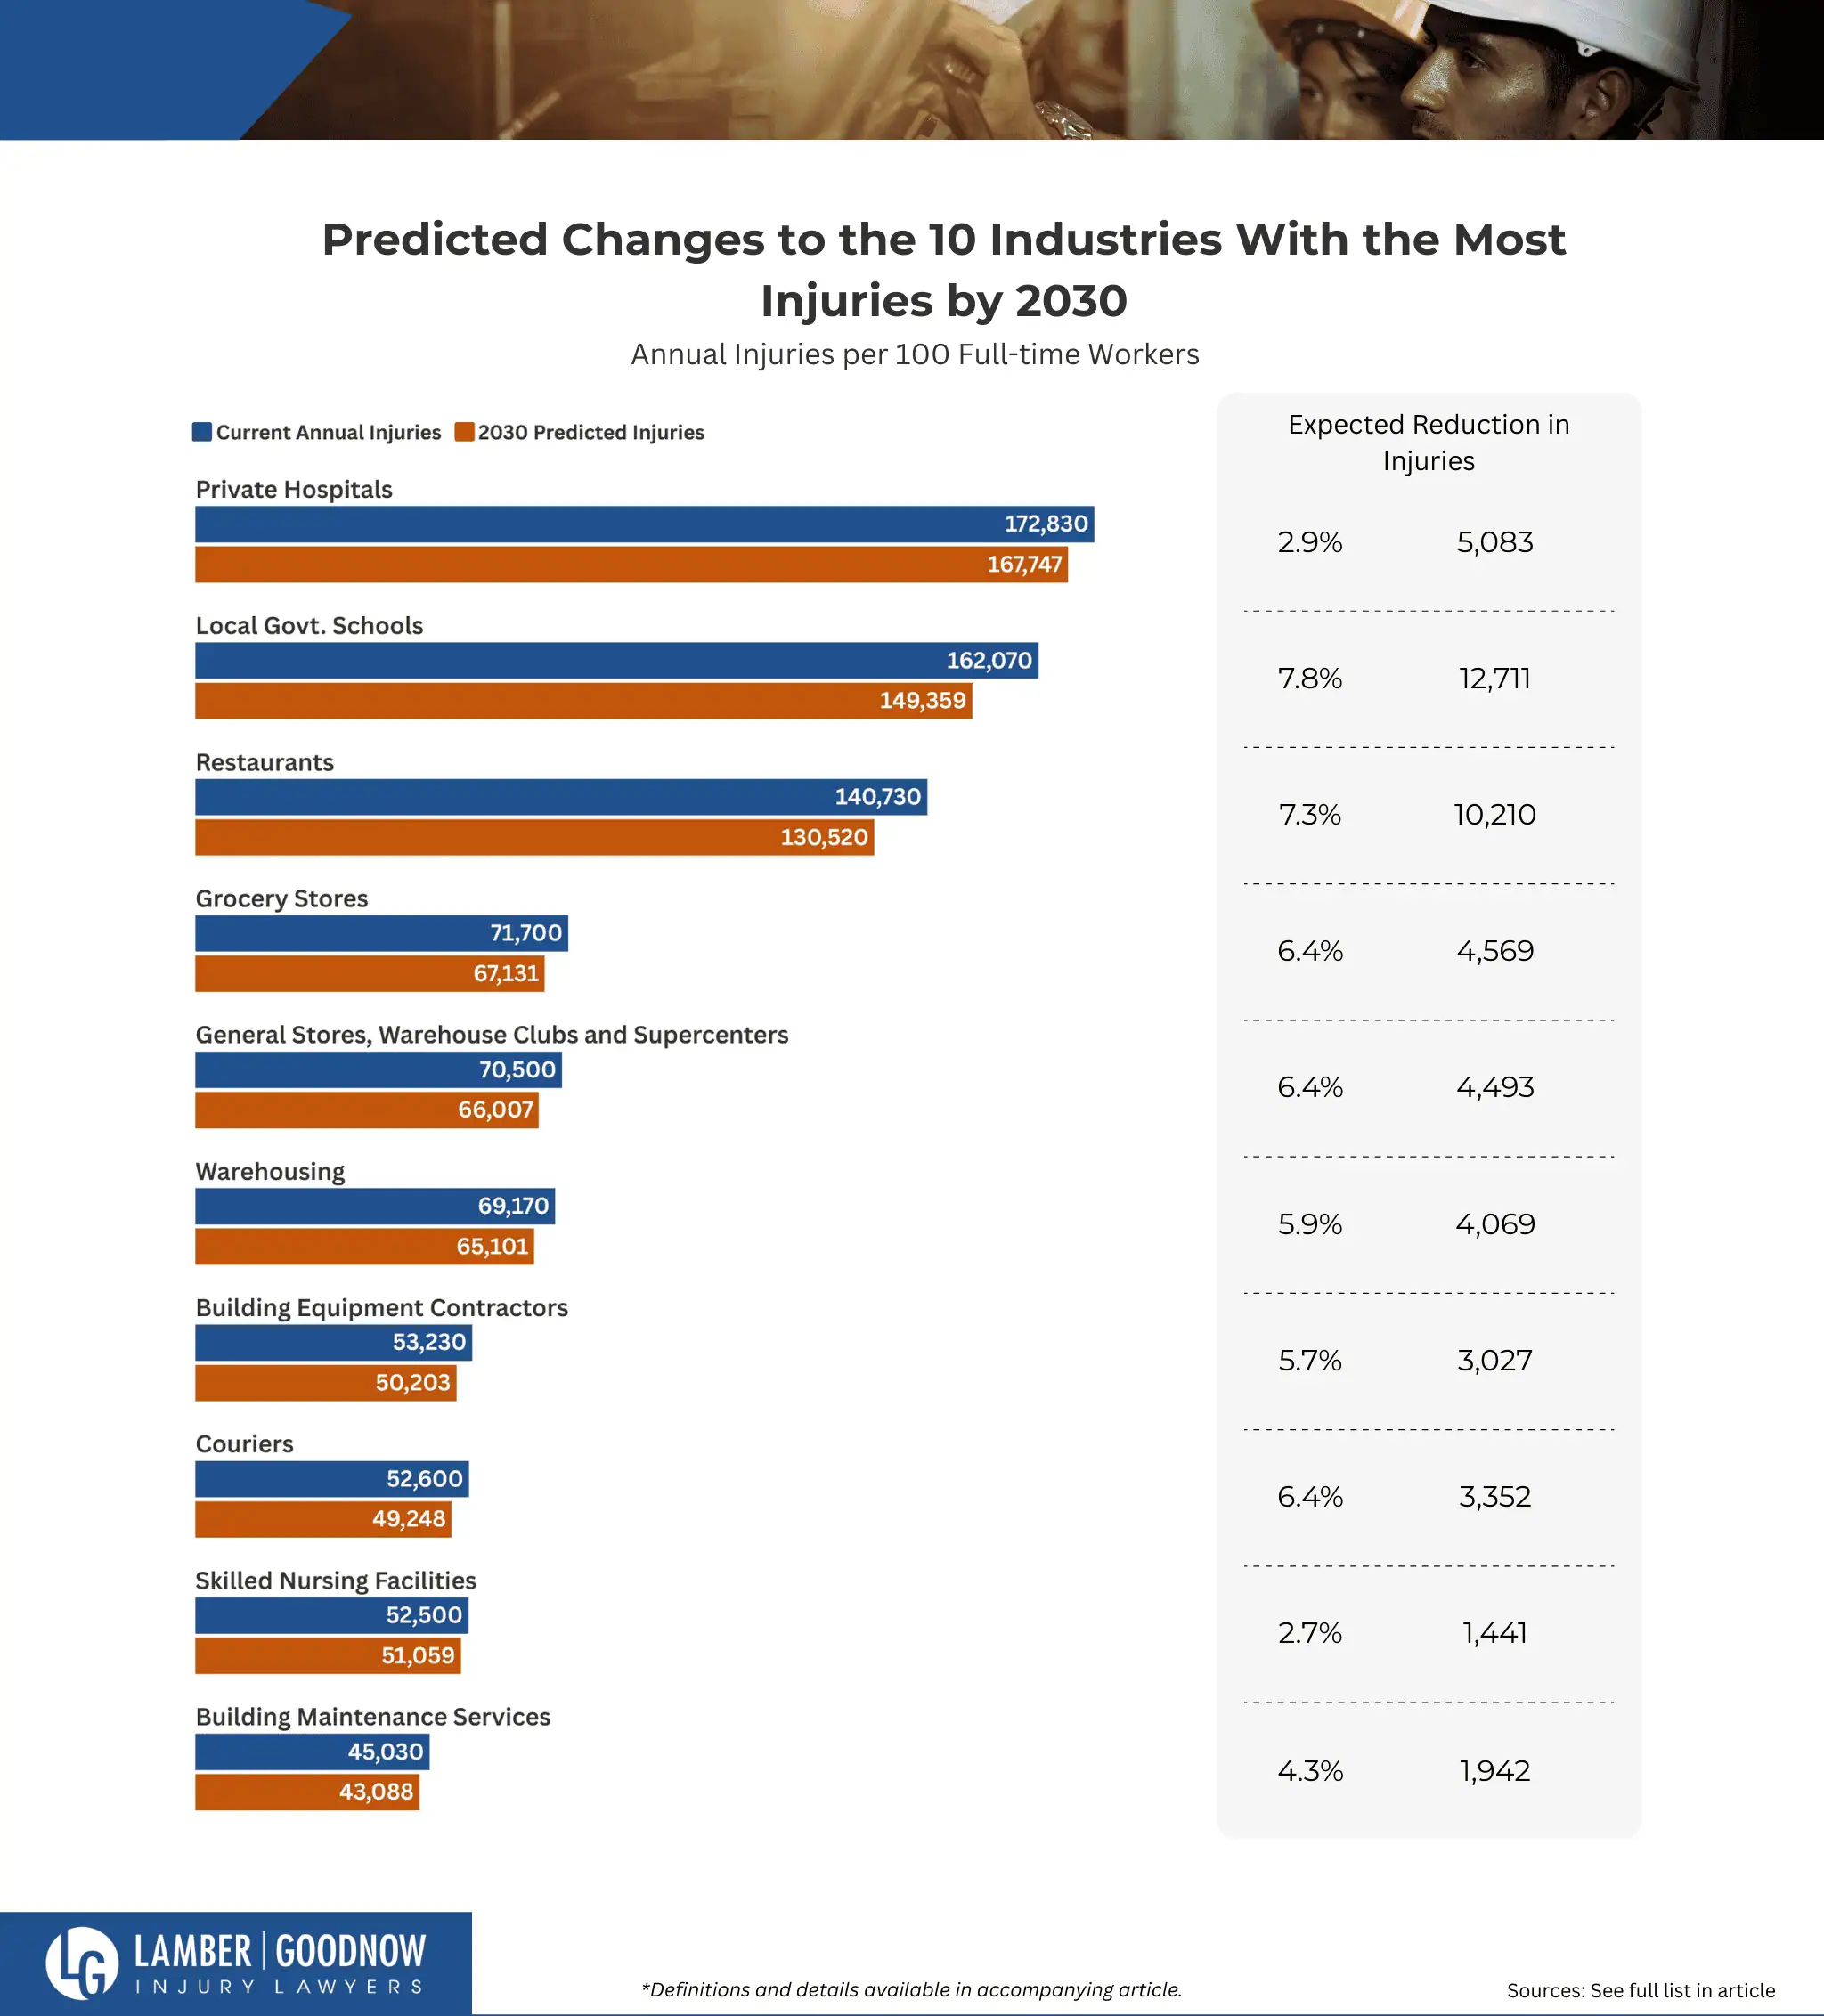
Restaurants and Local Government-run schools are two industries that are expected to each see 10,000 fewer workplace injuries per year by 2030.
2025 feels like the brink of an AI industrial revolution, and opinions on automation are extremely divisive. Critics talk of automation and artificial intelligence in terms of lost jobs, or worse, mass unemployment. Meanwhile, there is also more optimistic talk of economic boosts and digital liberation. While both prophecies could be exaggerations, the reality is that much of the workforce will need to adapt to a digitally reshaped labor market.
But that’s not the whole story. The automation conversation usually focuses on employment numbers, but what is often missed is how the work changes for people. When an industry is altered by automation, one outcome for employees is often a safer environment than before.
That matters when you consider that U.S. workplaces have recorded an average of 2.7 million injuries a year since 2020.
In this article, we draw on federal data, sector and industry automation forecasts, and expert opinion to explore how the coming wave of AI-driven change might make some jobs not only more efficient, but far safer.
30% Automated by 2030
The World Economic Forum projects that within five years, 30% of today’s workplace tasks will be automated, with predictions as high as 40% in particularly automatable sectors. Every industry is forecast to become at least 20% more automated than it is today by 2030.
The likely outcome is greater productivity, along with a rebalancing of the job market. Some roles will expand, others will fade, and many workers will face the need to retrain or switch fields. It will also lead to a much lower rate of workplace injury.
Historically, studies have found that a 10% rise in automation has corresponded with a roughly 2% reduction in workplace injuries. We’ve extrapolated from this to estimate how much safer the American workplace will become in the years to come.
A Safer Workplace in 2030
The predicted automation of 30% of tasks by 2030 is expected to reduce U.S. workplace injuries by 5.9%, preventing approximately 161,000 injuries annually within five years.
The largest drop in sheer injury numbers is projected in the private healthcare sector. Its injury incidence rate is expected to fall by 6.3%, which is only slightly above average, but the sector’s size means this change could prevent nearly 30,000 injuries annually at the national level.
The sectors that are currently less automatable are forecast to have a lesser improvement in safety. Arts, Entertainment, and Recreation, for example, is predicted to see a 4.3% drop in injuries. A 1,600 drop in injuries annually in the industry is, however, still an impressive figure.
Given that even these small improvements can mean thousands fewer injuries in high-density fields, we next honed in on the most dangerous industries and how they are expected to fare over the next five years.
Jobs that Remain Dangerous
Not all high-risk industries are equally positioned to benefit from automation. Four of the ten most dangerous have low automation potential and are likely to remain at least 97% as dangerous as they are today. For example, while the national average injury incidence rate is projected to fall to 2.29, the rate in State-run Nursing and Residential Care will only fall to 8.7, which is close to four times higher.
Others, like couriers and scientific professional services, are far more automatable, but also are significantly larger than some others on this list. Because of this, both are expected to see significant reductions in injury incidence rates, together preventing more than 6,000 injuries annually by 2030.
While the injury incidence rate is a good measure of how dangerous industries are, it only shows part of the picture. When looking for the sheer number of injuries and how this can improve, large industries with lower rates account for far more total injuries nationwide.
The Biggest Sources of Workplace Harm
Private hospitals are currently the industry with the single largest source of workplace injuries in the United States. By 2030, injury rates in this industry are expected to improve by just 2.9%, keeping its title as the leading contributor to occupational injuries.
Schools and restaurants rank second and third in total injuries. However, both are predicted to automate far more than other industries on this list, and thus each is expected to see 10,000 fewer injuries annually by 2030.
Couriers are the only industry to appear on both this list and the “Most Dangerous Industries” list. With both a high injury rate and a large workforce, it accounts for a significant share of injuries each year. However, its above-average automation potential means it could become much safer over the next decade.
Conclusion
Automation is predicted to move fast, and get faster – our sources estimate a 6% drop in workplace injuries in America over the next 5 years, driven by automation taking on 30% of current tasks. From there, researchers believe there is a 50:50 chance of AI outperforming humans in all tasks within 45 years and, eventually, automating all human jobs within 120 years.
Until then, we will continue to work alongside AI and automate hazardous work, thereby reducing injury rates. The political and sociological challenges that come with AI “co-workers” will likely continue for decades, but along the way, we can make work safer than it has ever been.
Methodology
Current workplace injury levels are based on averages from U.S. Bureau of Labor Statistics data for the years 2020–2024.
Sector-level automation projections were calculated by comparing 2025 automation levels to 2030 forecasts published by the World Economic Forum.
Industry-specific automation predictions were drawn from multiple sources (listed below). For healthcare-specific industries, estimates were calculated by averaging automation predictions for relevant roles from EIT Health.
The roles used in each healthcare industry category were as follows:
Psychiatric and Substance Abuse Hospitals
Psychiatrists; Nursing assistants; Clinical, counseling, and school psychologists; Recreational therapists; Occupational therapists; Speech-language pathologists; Medical records and health information technicians; Therapists (all other); Internists (general); Pharmacists; Pharmacy technicians; Nurse practitioners; Licensed practical and licensed vocational nurses; Nurse anesthetists; Medical assistants; Audiologists.
General Hospitals
Medical equipment preparers; Medical assistants; Pharmacy technicians; Medical and clinical laboratory technicians; Pharmacists; Medical records and health information technicians; Radiation therapists; Medical and clinical laboratory technologists; Dietitians and nutritionists; Speech-language pathologists; Audiologists; Nurse anesthetists; Ophthalmic medical technicians; Emergency medical technicians and paramedics; Magnetic resonance imaging technologists; Physical therapists; Family and general practitioners; Physicians and surgeons (all other); Obstetricians and gynecologists; Nursing assistants; Anesthesiologists; Oral and maxillofacial surgeons; Internists (general); Nurse practitioners; Occupational therapists; Licensed practical and licensed vocational nurses; Podiatrists; Surgeons; Genetic counselors; Pediatricians (general); Opticians; Nurse midwives; Psychiatrists.
Skilled Nursing Facilities
Medical assistants; Occupational health and safety technicians; Dental assistants; Medical records and health information technicians; Dietitians and nutritionists; Speech-language pathologists; Audiologists; Nurse anesthetists; Occupational therapy assistants; Physical therapists; Nursing assistants; Occupational therapists; Licensed practical and licensed vocational nurses; Surgeons; Healthcare practitioners and technical workers (all other); Recreational therapists; Opticians; Home health aides; Nurse midwives; Psychiatrists.
Nursing & Residential Care Homes
Nursing assistants; Licensed practical and licensed vocational nurses; Home health aides; Occupational therapists/assistants; Recreational therapists; Dietitians and nutritionists; Speech-language pathologists; Audiologists; Medical assistants; Medical records and health information technicians; Therapists (all other); Nurse practitioners; Opticians; Nurse midwives; Psychiatrists.
For niche industries—Non-typical livestock production and Non-conventional professional, scientific, and technical services—automation predictions for broader categories (Agriculture and Professional services, respectively) were used.
To estimate safety improvements, automation levels were converted into reductions in injury rates using the relationship found in research from the LEM Working Paper Series, Sapienza University of Rome (2025): a 10% increase in automation corresponds to a 1.96% decrease in workplace injuries. This relationship was applied linearly, meaning a 30% increase in automation would suggest a 5.88% reduction in injuries.
Definitions
Other Consumer Services:
Miscellaneous services sector, excluding public administration. E.g., Repair services, personal care, laundry services
Non-typical livestock Production:
Businesses engaged in raising animals not classified under typical livestock categories like cattle, pigs, poultry, or aquaculture. E.g., Beekeeping, Exotic animal breeding.
Non-conventional professional, scientific, and technical services:
Firms offering professional or technical services not covered by more specific categories like legal, engineering, or computer systems. E.g., Forensic experts, Consumer product testing labs (non-medical)
Sources
US Bureau of Labor Statistics – Table SNR05 – Non-fatal Injuries by industry
World Economic Forum – The future of jobs 2025
LEM Working Paper Series, Sapienza University of Rome (2025)
EITHealth – Transforming Healthcare with AI
McKinsey – Generative AI and the future of work in America
McKinsey – From blueprint to breakthrough


